Dearwester Grain Services, Inc.
  • Home
    • About Us
    • News >
      • Newsletter
  • Markets
    • Futures
    • Cash Bids
  • Grain
    • Customer Log In
    • Grain Calculator
    • Discount Schedule >
      • Discount Calculator
    • Average Price Contracts >
      • 2023 APC Weekly Pricings
      • Average Price Graphs
      • Historical Data
    • Basis Graphs
  • Feed
    • Feed Promo
  • Weather
  • Locations
    • Bentley
    • Carthage East - NSI
    • Carthage West
    • Clayton
    • Golden
    • Hull
    • Industry
    • La Prairie-Chatton
    • Liberty
    • Mt. Sterling
    • Paloma
  • Photos
  • Employment

Average Price Graphs​

The arrow in each graph indicates the time frame we run our Average Price Contract program for each commodity. By the graphs you can see the obvious reasons we run these at a certain time prior to harvest delivery.
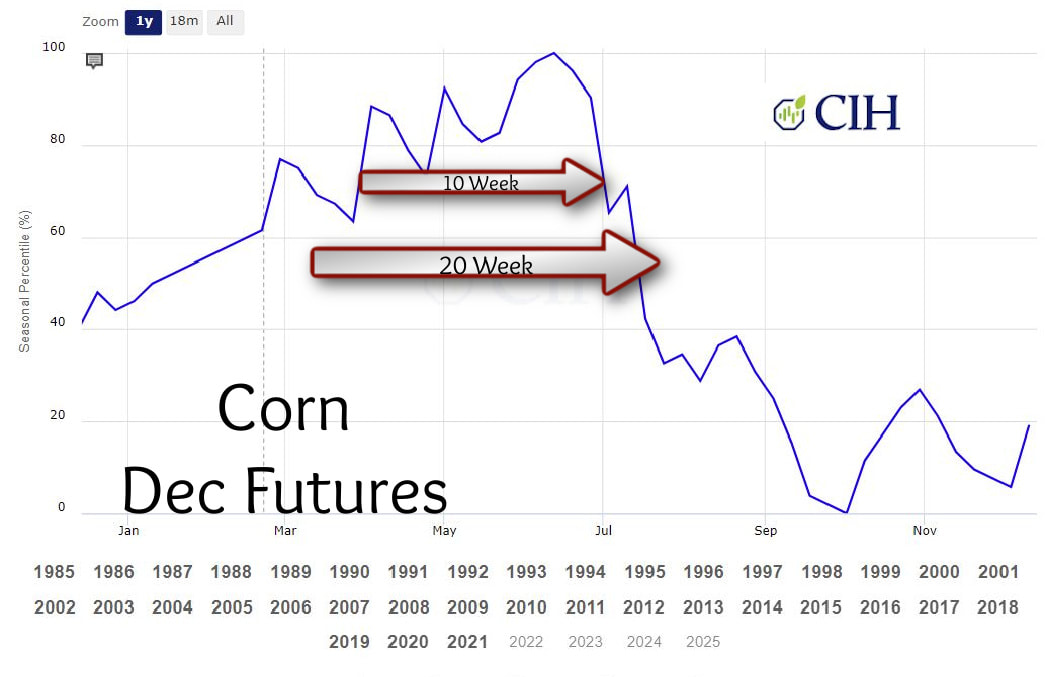
Picture

SEASONAL DEC CORN 

Picture

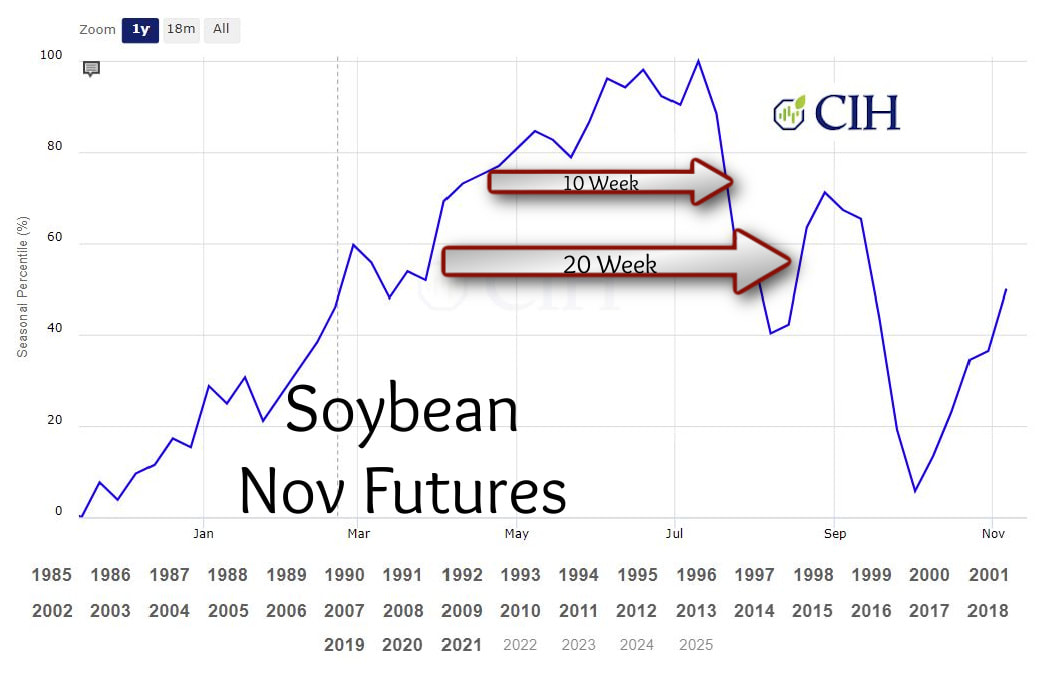
SEASONAL NOV SOYBEAN

We're Here for You.

 Dearwester Grain Services, 2019. 
Proudly powered by Weebly
  • Home
    • About Us
    • News >
      • Newsletter
  • Markets
    • Futures
    • Cash Bids
  • Grain
    • Customer Log In
    • Grain Calculator
    • Discount Schedule >
      • Discount Calculator
    • Average Price Contracts >
      • 2023 APC Weekly Pricings
      • Average Price Graphs
      • Historical Data
    • Basis Graphs
  • Feed
    • Feed Promo
  • Weather
  • Locations
    • Bentley
    • Carthage East - NSI
    • Carthage West
    • Clayton
    • Golden
    • Hull
    • Industry
    • La Prairie-Chatton
    • Liberty
    • Mt. Sterling
    • Paloma
  • Photos
  • Employment